Much has been made of the slowdown at Walt Disney World, with media reports dubbing the parks dead or ghost towns. If you’re skeptical about the claims that crowds are nonexistent or attendance is anemic, you’re smart. Calling the parks any degree of “empty” is an exaggeration, to put it charitably.
Let’s start with what is accurate, and that’s that crowds are down significantly year-over-year. You are likely to encounter lower wait times in 2023 than during the same times (weeks/months) in 2021-2022. This started after Easter, and mid-April through late May ended up being the slowest stretch at Walt Disney World since Fall 2021. Wait times rose before Memorial Day through late June, before dropping over the Independence Day holiday weekend. They’ve since rebounded a bit, and this week has actually been the busiest of summer.
Regardless, almost all of those dates have been less busy than their counterparts the last two years. This is something we’ve covered repeatedly in recent Walt Disney World crowd reports, and we don’t really want to belabor the point. Suffice to say, you’re looking at attraction wait times that are 6-8 minutes lower on average than the same dates last year. That may not seem like much, but it adds up over the course of the day and is the basis for decreased crowd levels. However, there’s one exception to this when the numbers are down much more: weekends.
There have been a lot of theories for the drop in attendance, which is definitely happening, regardless of claims to the contrary on social media. In fact, the Walt Disney Company has conceded as much and offered explanations as to why. Dearly-departed CFO Christine McCarthy attributed it to tough comparisons when “lapping” Walt Disney World’s 50th Anniversary. Still-current Disney Parks Chairman Josh D’Amaro reiterated this, and also suggested that the exhaustion of pent-up demand was playing a role.
Two weeks ago, Bob Iger offered the best explanation of all. He explained that Florida reopened before most other states and saw “revenge travel” earlier, and thus, it’s being exhausted sooner than elsewhere. Iger pointed to lower hotel occupancy tax collections in many major tourist hubs around Florida, and increased discounting at Universal and other theme parks. When specifically addressing the slow Independence Day holiday weekend, the former weatherman (yes, really) talked up triple-digit ‘feels like’ temperatures and 99% humidity.
In our view, Iger did not point to the most plausible explanation of all: Independence Day was a long weekend, and weekends have been significantly slower than weekdays at Walt Disney World in 2023.
Of course, that’s not really a “reason” in and of itself, but rather, a trend that has emerged as of this year. Basically, the Fourth of July holiday was like an exaggerated version of what we’ve been observing for pretty much all of 2023.
The more pronounced drop-off in attendance lended further credence to theories covered in crowd reports here, and in our recently updated Best & Worst Days to Do All Parks at Walt Disney World in 2023 that contains a discussion of this dynamic. But before we get ahead of ourselves with reasons why this is happening, let’s take a look at daily crowd levels and wait times for the year to date (all graphs courtesy of Thrill-Data.com):

This is easiest to interpret if you start on the far right–the two highest bars there are Monday and Tuesday, July 24-25. Before that, there are two consecutive days that are significantly lower green bars–Saturday and Sunday, July 22-23.
You can more or less follow it back from there, five yellow bars (weekdays) followed by two green bars (weekends). That is, until you get to July 1-4 (holiday weekend), which are the lowest green bars. The same 5 yellow, 2 green trend is visible before that, until things get a bit wonky in May, which was low across the board.
Jump back even further, and you can see the same pattern play out over Spring Break, and even mid-January through March. Obviously, there are spikes for the usual holidays and school breaks–MLK Day, Mardi Gras, Presidents’ Day, Spring Break, Easter, etc–but the trend is visible even among those periods of higher crowd levels.
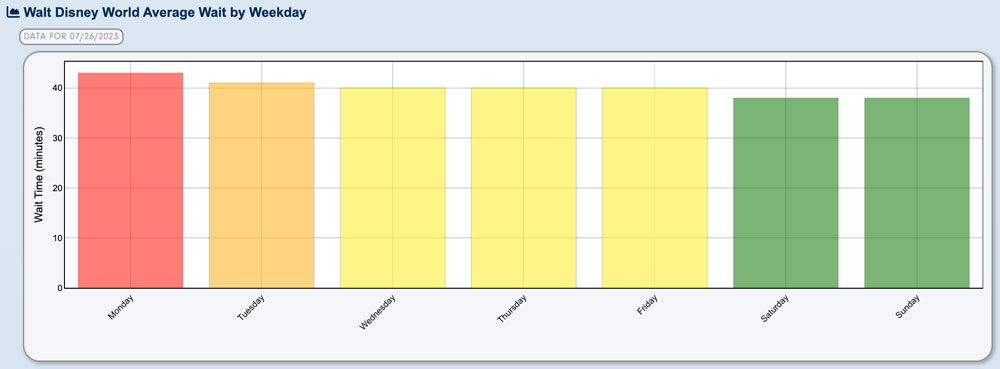
In case you remain unpersuaded by the YTD daily crowd levels (or if the graph is too difficult to discern…or whatever), above is a look at average wait times by day of the week. Here, it becomes apparent that Saturday and Sunday are now the slowest days of the week at Walt Disney World.
With that said, this actually understates the trend. This graph of average waits day of the week is calculated on a rolling basis that also encompasses many dates from last year, including Party Season at Magic Kingdom. However, the trend we’re discussing didn’t truly become apparent until 2023. This means that it’s averaging elevated Saturdays and Sundays from last year along with the lower ones from this year.
The end result is still that weekends are slower, but the degree to which that’s true is not fully evident from the graph. The difference between Sunday and Monday is not 6 minutes per attraction–it’s more like 7-9 minutes. A seemingly small discrepancy, but a meaningful one in the grand scheme of things (and when calculating crowd levels).
Now that we’ve established that this pattern is occurring and you are (hopefully) convinced that it’s real, let’s discuss the potential explanations.
When this trend first became apparent, we posited that it could be a shift towards shorter duration trips. In speaking with travel agents and ticket sellers, we’ve heard countless reports that guests are reducing the length of their visits due to rising costs. Rather than 5-6 day trips and stays, more people are doing 3-4 day Walt Disney World vacations. Of course, this is entirely anecdotal–and the plural of anecdote is not data.
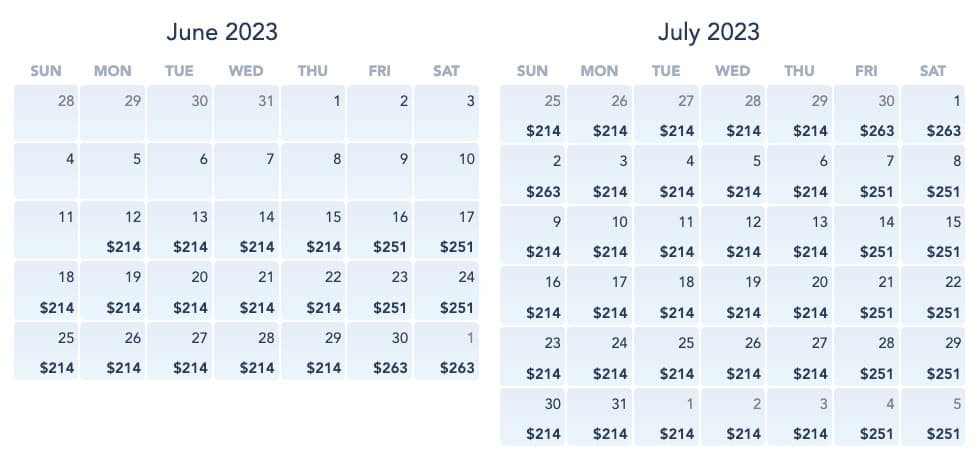
Consumers being more cost-conscious is also supported by higher prices on park tickets, accommodations, and airfare over the weekends. The above chart shows the nightly standard room rates at Disney’s Pop Century Resort. Notice how much more expensive Friday and Saturday nights are as compared to Sundays through Thursday? It’s typically $37 less for weeknights!
It’s a similar story for single-day park tickets, which are typically $5 to $10 cheaper on weekdays than Saturdays or Sundays. (Although Disney diehards who read blogs like this probably never buy them, 1-day tickets are incredibly popular with average visitors.) Unsurprisingly, the most expensive day of the week to fly is Friday; this would mean fewer budget conscious consumers are doing their first day in the park on Saturdays.
Another major explanation is blockouts. The Pixie Dust Annual Pass is blocked out every Saturday and Sunday, and there’s likely a ton of this AP in circulation.
The Pixie Dust Annual Pass costs $399, which is almost half the price of the Pirate Pass, which is the next tier up. It is considerably cheaper than the top two tiers, which are $969 and $1,399 before tax. So again, cost-conscious consumers are likely opting for the Pixie Dust AP and sacrificing weekends to save money.
Equally as significant, the Pixie Dust tier was the only Annual Pass available for over a year, so even Floridians who wanted weekends were stuck with the Pixie Dust AP as their only option for a while. It’s possible that this will change as more of these Annual Passes come up for renewal, but it’s also possible that the exhaustion of pent-up demand and spending slowdown will result in downgrades, making that more or less a wash.
Earlier this year, it wasn’t just Annual Pass blockouts. Cast Members are also subject to blockout dates and reservation availability, both of which have become non-issues this summer. This winter and spring, there was a weekdays-only Florida resident ticket.
Notably, the current Discounted Florida Resident Summer Magic Ticket that runs through September 29, 2023 is not blocked out on Saturdays and Sunday. Much more significant is the 4-Park, 4-Day Walt Disney World Magic Ticket. This is available to the general public and offers $99 per day admission without requiring reservations. It’s our understanding that this ticket has been hugely popular, and it’s also not blocked out on weekends!

However, both of these aforementioned Summer and Fall 2023 ticket deals were blocked out July 1-4, 2023.
When paired with everything else, that right there would seem to be the primary explanation as to why crowds were down so significantly for Independence Day. It was a long holiday weekend–a time that would normally be very busy at Walt Disney World. And yet, average crowd levels were 1/10 and July 4 was the slowest day of the entire year so far.
On top of those blockouts for the two ticket deals, resort rates were elevated. It wasn’t “only” a $37 difference for Pop Century–it was $49 per night more expensive. And that’s a standard room at a Value Resort. The cost difference at Moderates and Deluxes was much more significant.
When you take the pool of people who could not visit over the holiday weekend due to blockouts and add to them the pool of cost-conscious consumers who deferred until prices were lower, it’s much easier to explain why that particular drop was so pronounced, and worse than an average weekend in 2023.
It certainly makes a lot more sense than the weather. It’s not like Central Florida is exactly known for its mild summers, and it’s also not as if temperatures plummeted post-holiday. Sure, that weekend was bad even by Orlando standards, but hot and humid summers are very much a known quantity that’s already largely ‘baked in’ to crowd levels. The worse weather was, at most, a minor contributing factor.

Given all of this, you might be wondering what happens next. Honestly, it’s difficult to say.
One prediction I am rather comfortable making is that September 1 to September 4, 2023 will be a repeat of Independence Day weekend. Perhaps even slower. For one thing, Labor Day is never a busy holiday as compared to the heavy hitters. Kids are back in school and it’s Florida’s off-season for tourism. Crowd levels are typically elevated relative to random weekdays in August or September, but low as compared to pretty much any other time frame.
The difference this year is that the same tickets that were blocked out for Independence Day weekend are also blocked out for Labor Day weekend. Room rates are also elevated, as are regular single day ticket prices. Weather is obviously a wild card, but I’ll go out on a limb and say it’ll probably be hot and humid. (Just like the other 44 weeks of summer in Florida.) In short, it’s the exact same setup that resulted in lower crowd levels over the Fourth of July.

Beyond that, the difficulty comes in large part with the start of Party Season, EPCOT Food & Wine Festival, plus the popular Halloween and Christmas festivities, as well as conventions and other special events. All of this can distort attendance trends from October through December. (And to a lesser extent in August and September.)
Normally, the busiest day of the week in Magic Kingdom from mid-August through December would be Saturday–by a fairly significant margin. That’s caused by Mickey’s Not So Scary Halloween Party and Mickey’s Very Merry Christmas Party displacing guests due to shorter operating hours, coupled with locals (previously) being more inclined to visit on weekends. Plus some other factors.
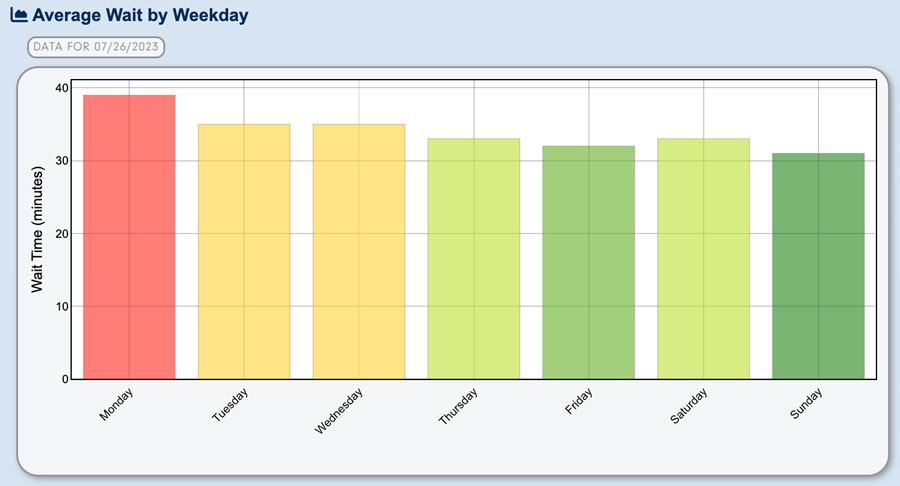
Will that be true this August through December? I cannot say with a high degree of certainty. My guess is that the current conditions will collide with that consistent pattern, resulting in Saturdays at Magic Kingdom being busier than they are right now but still not nearly as bad as during the Party Season in prior years.
However, I’m much more inclined to predict that Monday will be the day that gets hit really hard. That’s the safer bet, both because of all of the above and since it’s another day of the week that typically does not have MNSSHP. Monday is currently the worst day of the week at Magic Kingdom (see above), so it’s hardly a bold bet to predict that it’ll continue to be bad. Mondays at Magic Kingdom will be bad for the rest of 2023, no prediction needed.
What I’m actually saying is that Mondays will get even worse, at least relative to other days of the week–especially ones when MNSSHP is held. Stated differently, the gap between Monday and Tuesday crowd levels at Magic Kingdom is going to grow.
I’ll also make the not-so-bold prediction that ‘feels like’ crowds will worsen at EPCOT on weekends. Already, there’s a disconnect between wait times and congestion at EPCOT, as it’s the main local’s park…and a lot of locals do disproportionately fewer attractions than tourists.
There’s a lot more that could be said about EPCOT attendance trends, but this is already wordy. The bottom line is that wait times never tell the full or even partial story of crowds at EPCOT, and that’s doubly true during Food & Wine. EPCOT might continue to have below-average crowd levels on Saturdays and Sundays this fall, but that’s as measured by wait times. Visitors to the park will likely report dramatically different experiences. In this case, trust the anecdotes over the data.
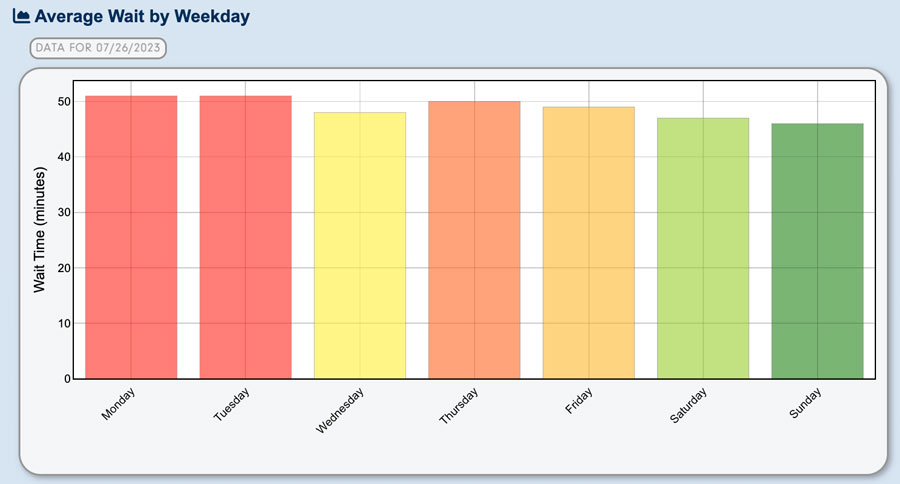
I’d also continue visiting Disney’s Hollywood Studios on Saturdays or, better yet, Sundays. These are currently the best days of the week to do DHS (see above) and that’ll likely continue.
To whatever extent the dynamic changes at Magic Kingdom and EPCOT, it shouldn’t really have much of an impact on DHS. It didn’t last year. That seems like a pretty safe bet.
Same goes for Animal Kingdom. We put far less emphasis on the best day for that park than the best time of day. So long as you arrive early or late, DAK is easily beatable. If you hate money and are concerned about having too much of it, you can also arrive midday and buy Genie+ and Lightning Lanes.
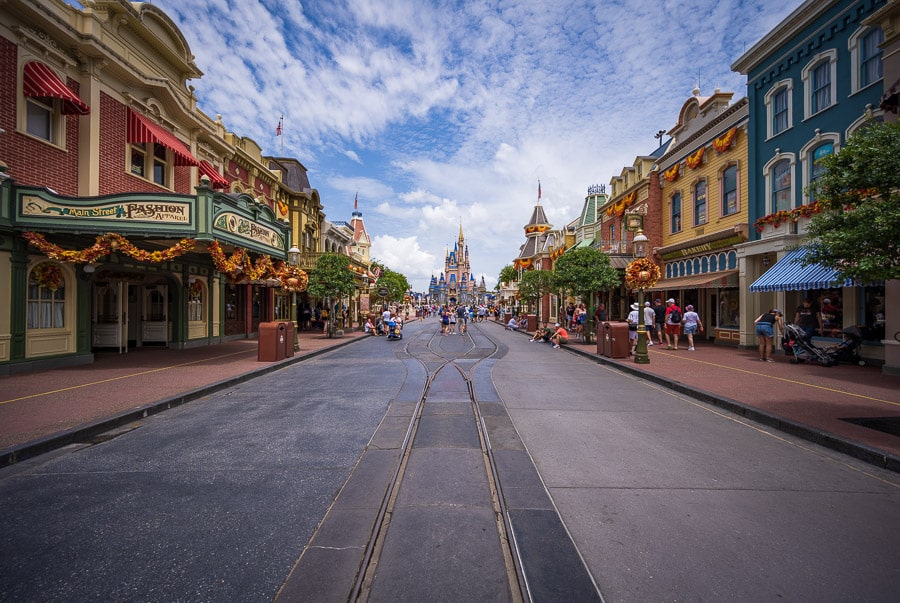
For me, the biggest question is whether to do Magic Kingdom on the day of MNSSHP or MVMCP–our very strong advice last year–or on a Saturday. Due to the shorter operating hours, crowds will be lower on party days. That is as certain as crowd forecasts can possibly get.
The real question is whether all of the above is enough to depress Saturday attendance to the point that the higher (as compared to party days) crowd levels are still low enough to be “worth it” for the additional ~3 operating hours and fireworks. That’s a question we can’t answer (yet) but hope to be able to speak to credibly by late August.
Even then, the answer will likely be a variation of “it depends.” The determining factors are likely to be what matters more to you: ultra low crowds or fireworks. Whether you’re visiting will also make a difference. Saturday crowds will be much more bearable August and September and other off-peak dates than school breaks (etc.) in October through November.
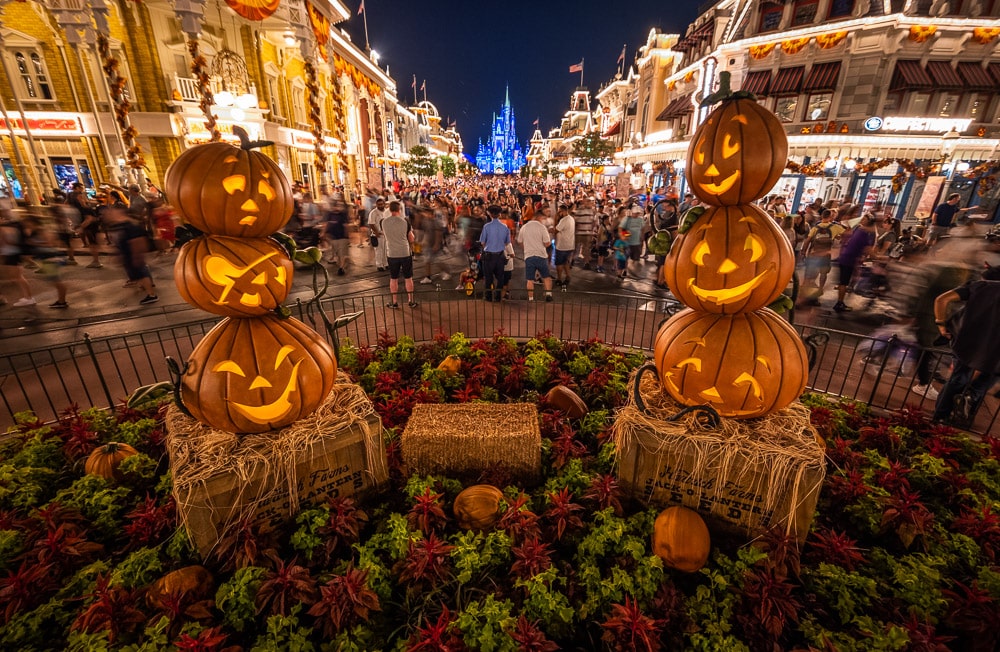
Ultimately, that’s what we’ve been seeing with Saturday and Sunday wait times versus weekdays. It’s also what we’re expecting going forward for the rest of this year and probably much of 2024. We’ve been discussing our possible theories that explain this for several months, but what happened over Independence Day coupled with the few weeks since have really solidified things in our minds.
Based on all of this, you might think that Walt Disney World needs to pull one of its “levers” that gets people into the parks on Saturdays and Sundays. There’s only so much there that’s in their immediate control, though. There’s also the reality that Walt Disney World is really slow to identify and address shifting attendance patterns. Eventually, they’ll either figure out a better balance by adjusting weekday vs. weekend prices, or it’ll work itself out naturally with the Annual Passholder distribution. But it won’t be a quick fix. I’d expect some version of this pattern to continue into 2024 at Walt Disney World.
Planning a Walt Disney World trip? Learn about hotels on our Walt Disney World Hotels Reviews page. For where to eat, read our Walt Disney World Restaurant Reviews. To save money on tickets or determine which type to buy, read our Tips for Saving Money on Walt Disney World Tickets post. Our What to Pack for Disney Trips post takes a unique look at clever items to take. For what to do and when to do it, our Walt Disney World Ride Guides will help. For comprehensive advice, the best place to start is our Walt Disney World Trip Planning Guide for everything you need to know!
YOUR THOUGHTS
Thoughts on weekdays vs. weekends crowds at Walt Disney World? If you’ve visited this year on a Saturday or Sunday, what did you think of crowds and wait times? Any parks or times of day noticeably worse than the others? Do you agree or disagree with anything in our theories or predictions? Any questions we can help you answer? Hearing your feedback–even when you disagree with us–is both interesting to us and helpful to other readers, so please share your thoughts below in the comments!


