It’s time for an on-the-ground report on off-season crowds at Disneyland, which is experiencing a slowdown with summer ending and holidays on the horizon. We’ll take a look at August 2023 wait times, how busy the parks are right now, and “revenge travel” burning out. Plus, predictions for Halloween at Disney California Adventure and Disneyland.
Let’s start by bringing you up to speed on crowds at Disneyland for the second half of summer season. Late July saw a very slight spike, albeit not nearly to the same degree as Walt Disney World. Otherwise, wait times were pretty consistent throughout the month with day of the week trends being a better predictor of crowd levels than anything else.
A more pronounced spike actually occurred in early-to-mid August, which is something we did not see at Walt Disney World. This happened right before Los Angeles and Orange County schools went back into session, suggesting it was a “last hurrah” for locals. The difference in timing of this same dynamic for Florida vs. California underscores the tourists vs. locals demographics of the respective coasts.
Otherwise, this summer in Disneyland more or less paralleled our recent crowd reports from Walt Disney World, except with higher numbers in the California parks. For those skeptical of these reported trends, the company itself has acknowledged as much, attributing it to an exhaustion of pent-up demand that’s lagging at Disneyland since California reopened later.
Against that backdrop, let’s turn to the numbers. Note that what’s covered here is posted wait times pulled from the Disneyland app and compiled into graphs covering various days, weeks, months, and years. Posted wait times are good for identifying big picture trends, but the data is not conclusive of in-park congestion or “feels like” crowds.
Posted wait times offer insight into how busy Disneyland is, but they are an imperfect measure of crowds, especially if you’re comparing current conditions to prior years. Disneyland attendance has increased by several million people since the overhaul of Disney California Adventure, and demographics have also shifted. The end result is that the majority of days in 2023 will be more crowded than their counterparts in 2012, 2015, 2017, etc.
With that out of the way, let’s dig into the data and look at Disneyland Resort wait times. As always, all graphs and stats are courtesy of Thrill-Data.com:
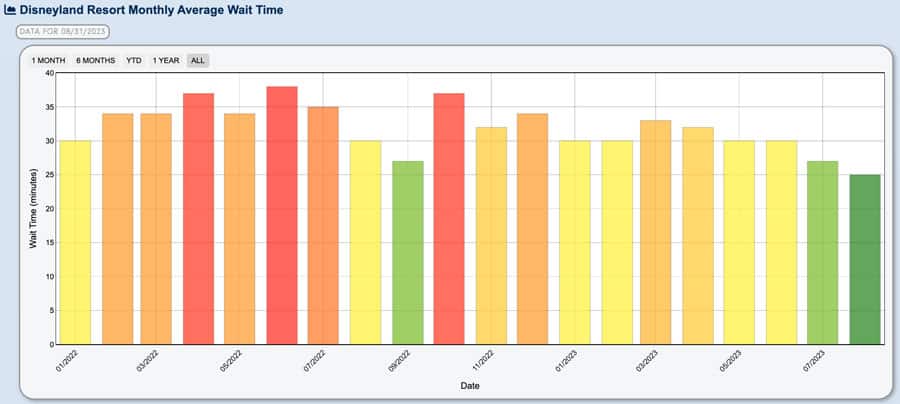
Let’s start with the monthly numbers for Disneyland as a whole. As compared to the same months in the prior year, April and beyond have seen a noticeable drop in average wait times.
This is most pronounced in June and July. Last year, those two months were 10/10 and 8/10 crowd levels, respectively. This year, wait times are down by 8 minutes on average and summer crowds were typically 5/10 or below. August 2023 averages are “only” down by 5 minutes as compared to the same month last year, but that’s still a 1/10 on the crowd calendar.
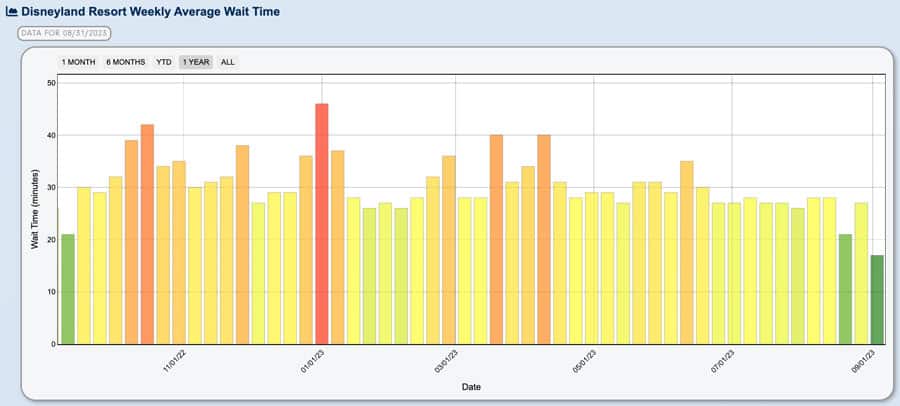
Above is a look at weekly wait times at Disneyland. This shows the peak of summer happening the second week of June, with crowd levels pretty stable after that until this past week. (Ignore the second-lowest green bar two weeks ago, there was a data collection error one day that skews the numbers and unfortunately cannot be excluded from the calculation.)
With both the month and week views, it’s important to emphasize that unfavorable comparisons are the reason why crowd levels are so low this year. There was a significant amount of pent-up demand from Summer 2021 through the duration of 2022, and current crowd levels are judged against that “revenge travel” era at Disneyland.
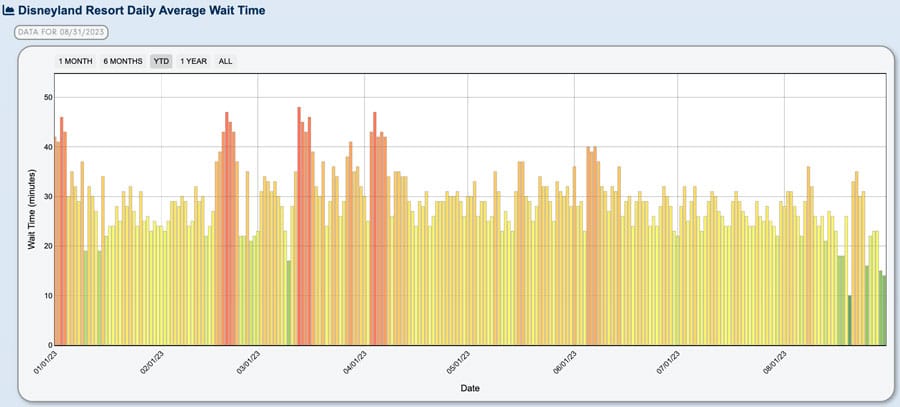
Looking at daily numbers across all of Disneyland year-to-date, it’s a story that’s somewhat similar to our wait time reports from Walt Disney World–except with higher averages across the board. Summer never hit the same high highs as the winter holidays or spring break season, but that’s to be expected. Summer is a longer school break, so families aren’t concentrated into the same set of limited dates.
But this is also a story of pent-up demand exhausting itself. On both coasts, spring break seemed like it was the last gasp of those crazier crowds fueled by travelers making up for lost time. There have still been plenty of days that have felt very busy in June through August, but if you’re measuring objectively against the last year–which is what these graphs are doing–there’s been a pronounced drop-off. It’s basically a return to reality.
With the wait times data out of the way, let’s turn to commentary. We pop into the parks on a regular basis, and just did a long weekend at Disneyland with several consecutive rope drop to park closing days. That also coincided with the pronounced drop-off in crowd levels from August 24 to 25, which is a big reason why we’re sharing this report now.
There is never consensus when it comes to crowd reporting. (It’s better at Disneyland than Walt Disney World, as the more local-centric parks mean more fans with weekly experience, rather than yearly, which offers a much better frame of reference.) No matter what the data shows, there will always be people who claim the exact same dates were actually the ‘busiest they’ve ever seen the parks’ or ‘least busy they’ve ever seen the parks.’ With the exception of holiday weeks, those responses happen pretty much without fail.
However, I’m incredibly confident that anyone who visited Disneyland on both August 24 and 25 would’ve been able to easily spot the difference. August 24 had an average wait time of 31 minutes, numerical crowd level of 5/10, and ‘feels like’ congestion that was, in my anecdotal opinion, much worse.
By contrast, August 25 had an average wait time of 16 minutes, numerical crowd level of 1/10, and ‘feels like’ congestion that was minimal–especially after having experienced the previous day. The relative drop-off was pronounced and patently obvious to anyone in the parks–a night and day difference. That was the exact day that the slow season started at Disneyland Resort.
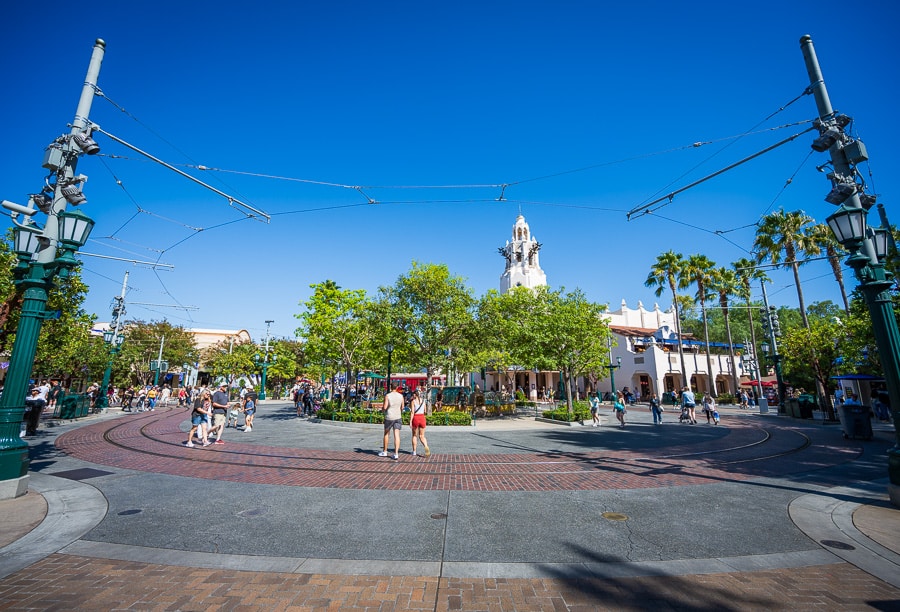
Congestion picked up somewhat noticeably over the weekend and wait times were up slightly through Monday, but it still wasn’t bad at all. Relative to Friday, sure, a lot busier. Relative to Thursday, the entire summer, or last year, still very manageable!
Unfortunately, we haven’t been in the parks the last few days as drop levels have dropped even further, but if posted wait times we’ve seen while perusing the Disneyland app are any indication, it’s been glorious. No real surprise there, as this follows the established crowd trend over the course of the last several years–but with an even steeper drop-off in the post-revenge travel era.
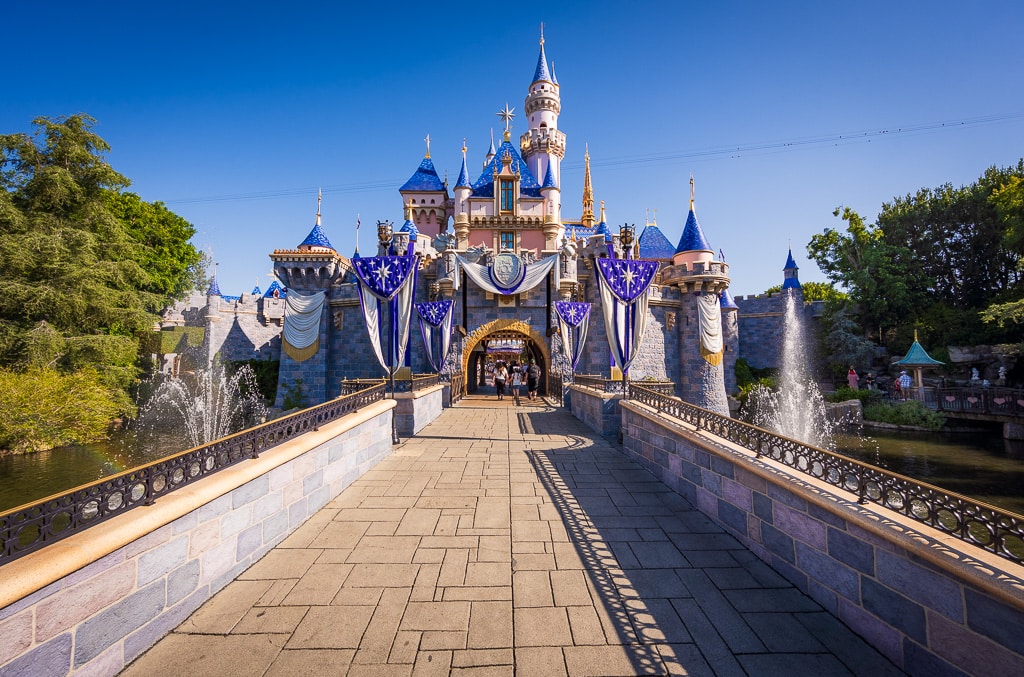
In terms of other observations, we continue to notice lower-than-last-year attendance in the morning. It probably goes without saying, but crowd levels are not static throughout the day. During a normal tourist season, Disneyland would see an increase in earlier arrivals, as visitors on vacation are more inclined to arrive for or closer to rope drop. By contrast, locals are more likely to arrive late.
I did several rope drop days at both Disneyland and DCA (sadly, no Early Entry this time), and found the crowd levels to be super low until around 11 am. This strongly suggests that there are fewer tourists as a percentage of guests. Expect this to continue throughout September 2023, which is California’s off-season for travel–there are always fewer tourists then. It’s more notable for end of summer since that’s typically tourist season.
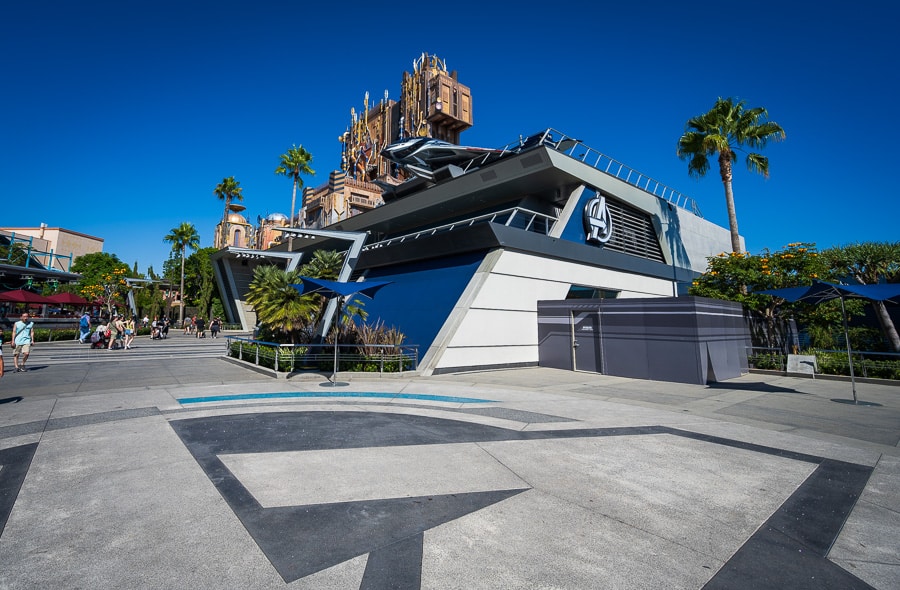
Beyond the exhaustion of pent-up demand, it’s also possible that people have been postponing their visits due to Fantasmic and high number of attraction closures. This is more outcome-determinative of crowds at Disneyland than it is at Walt Disney World because the demo skews far more local and impulsive at Disneyland. It’s not just the hundreds of thousands of Annual Passholders within driving distance in Los Angeles, Orange, San Diego, Riverside, and San Bernardino Counties.
People from Northern California and the surrounding states also take a lot of quick trips to Disneyland and have a great degree of flexibility in their visits. They can delay if Fantasmic isn’t being performed, their favorite dark rides are down, or if they’re still sitting on pins and needles for new gift shop in Avengers Campus to open. You never know with Disneyland fans.
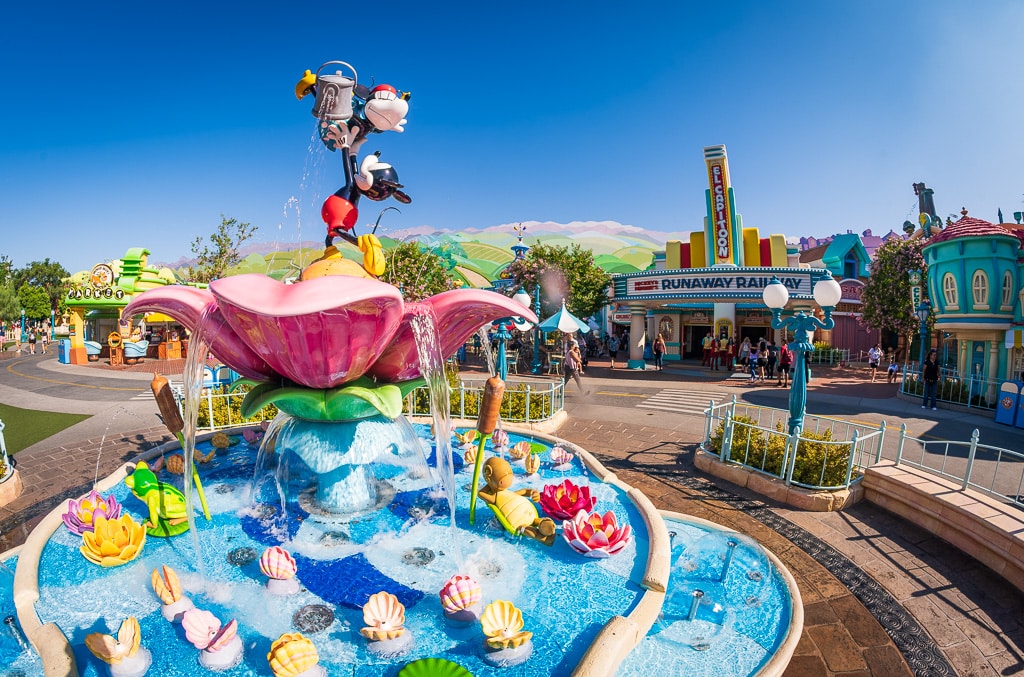
Regardless of the reason, you can accomplish a lot in the first few hours of the day at Disneyland and Disney California Adventure. You can still rope drop Peter Pan’s Flight and knock out the entirety of Fantasyland with minimal wait. You can also hit Star Wars: Rise of the Resistance at rope drop for a 30 minute or less standby wait.
For that matter, you can do Star Wars: Rise of the Resistance even after that initial wave and still not have too long of a wait. Same goes with Mickey & Minnie’s Runaway Railway, Space Mountain, and Indiana Jones Adventure. All of these rides can have longer wait times later in the day–and lines that move at a snail’s pace due to the Lightning Lanes–but they’re are blissful early on. They are also, unfortunately, all in different corners of the park, which makes strategizing tricky unless you don’t mind a lot of backtracking.
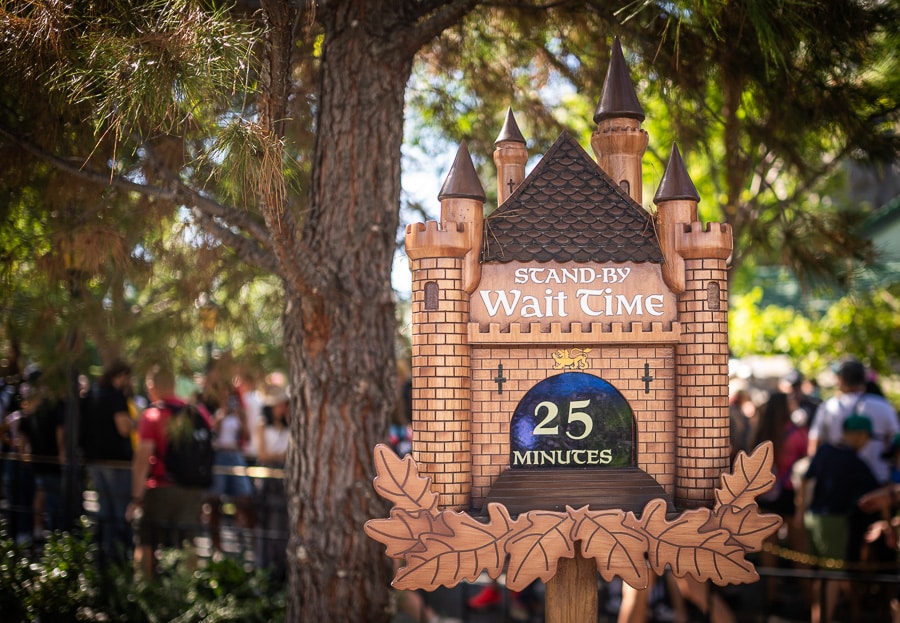
Looking forward, the next few weeks should continue to be the slow season at Disneyland. In terms of “feels like” crowds, the end of August is probably as good as it’s gonna get. Halloween Time at Disneyland kicks off with the start of September, and that’ll draw locals to the parks to do Haunted Mansion Holiday, eat food, take photos, and loiter about. So congestion will worsen, and this weekend will probably defy normal day-of-week trends.
Objectively speaking, average wait times should remain low. Although Los Angeles and Orange County schools are already back in session–as is most of California and the West Coast–there are still some stragglers. Not only that, but school resuming has been at least partially offset by AP blockouts lifting in mid-August. Many of those Magic Key Passholders have now taken their ‘homecoming’ visits after being blocked out most of the summer, meaning that a small scale or localized version of pent-up demand has also just played out.
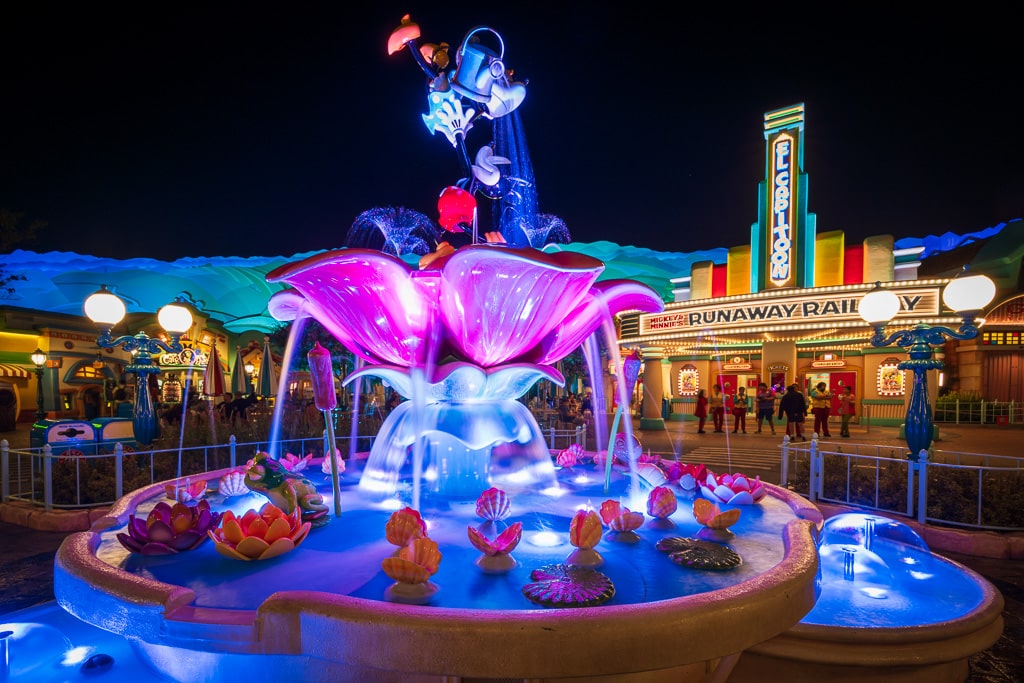
Suffice to say, it’s likely that wait times will remain relatively low for the next few weeks even as congestion increases. One thing to note here is that our prediction that Labor Day Weekend Will Be ‘Dead’ at Walt Disney World absolutely does NOT apply to Disneyland.
The big reason for that prediction with the Florida parks is more aggressive blockouts for both Annual Passholders and ticket deals. Although there are Magic Key blockouts for the holiday weekend, they’re fairly normal. Moreover, the current Californian ticket deal is not blocked out for Labor Day. And it’s the start of Halloween. All very big differences!
Labor Day still is not a truly busy holiday weekend at Disneyland; relative to Easter or Columbus Day, it’ll be pretty manageable. But it most definitely will not be “dead” or anything of that sort.
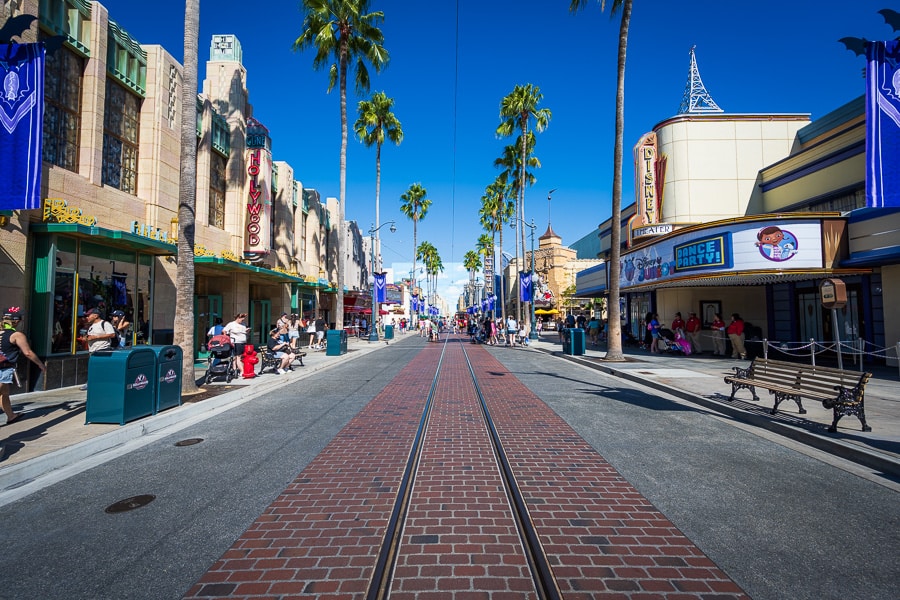
After a slight spike for the holiday weekend, expect crowd levels to retreat for the first two weeks of September. Day of week trends will be the biggest consideration, followed closely by Oogie Boogie Bash Halloween Party dates. That’ll cause some mild disruptions to attendance dynamics, while also creating crowd discrepancies between Disneyland and Disney California Adventure.
Crowds are likely to increase in the second half of September, with October seeing a significant spike, including days and weeks that are 8/10 or above crowd levels. Fall breaks in Northern California, Nevada, and Utah have huge impacts. While I’d expect most dates even in those 3 months to be down year over year, that’s relative. In absolute terms, it’s likely that most guests will find most dates to be “very busy” during the heart of the Halloween and holiday seasons.

That context about what “slowdown” means is important. The parks are not going to be dead or ghost towns, or even on par with the emptiness seen in recent weeks at Walt Disney World. It’s just going to be less busy–maybe by 20% or so–as compared to last year. That’s enough to have a huge impact on objective crowd levels, but not so much on subjective congestion levels.
Point being, it’s not like Disneyland and DCA are struggling, or anywhere close to it. Rather, the parks are coming down from nearly two years of revenge travel, during which time supply (of reservations) exceeded demand on many days and the parks were packed even as the company limited attendance.
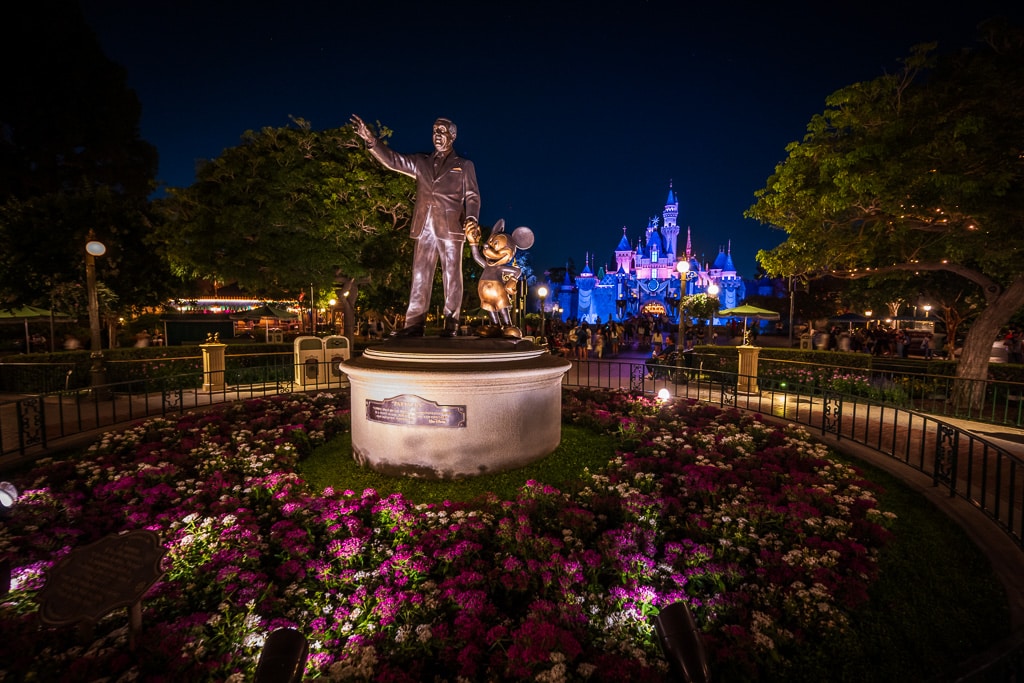
Ultimately, what Disneyland is experiencing is a gradual return to normal–and hopefully this trend continues. A slowdown from unprecedented demand is not a catastrophe, it’s a normalization. Disney would’ve loved to maintain record-breaking numbers or that growth trajectory, but frankly, all of that pent-up demand was a distortion and one that made the parks downright uncomfortable at times.
Putting that in the rearview mirror is good for consumers and even the long-term health of Disneyland. The parks not doing record-breaking numbers regardless of the guest-unfriendly decisions and changes they make–and instead having to actually compete for customers–is very much a good thing. That may not be the case for the company’s bottom line on the next quarterly earnings call, but it most certainly is in the long-term and from the perspective of guest goodwill and brand reputation.
Planning a Southern California vacation? For park admission deals, read Tips for Saving Money on Disneyland Tickets. Learn about on-site and off-site hotels in our Anaheim Hotel Reviews & Rankings. For where to eat, check out our Disneyland Restaurant Reviews. For unique ideas of things that’ll improve your trip, check out What to Pack for Disney. For comprehensive advice, consult our Disneyland Vacation Planning Guide. Finally, for guides beyond Disney, check out our Southern California Itineraries for day trips to Los Angeles, Laguna Beach, and many other SoCal cities!
YOUR THOUGHTS
Thoughts on the post-summer slowdown in crowds at Disneyland? Predictions on crowds for September 2023? Think next month will be more or less busy than August? If you’ve visited last month (or especially August 24 vs. 25), what did you think of crowds and wait times? Any days or times seem noticeably worse than the others? Do you agree or disagree with anything in our report? Any questions we can help you answer? Hearing your feedback–even when you disagree with us–is both interesting to us and helpful to other readers, so please share your thoughts below in the comments!


