October 2023 is halfway over, and already Walt Disney World crowds are worse this month than anytime over the entire summer. This wait times report covers data for the month-to-date at Magic Kingdom, EPCOT, Hollywood Studios, and Animal Kingdom, plus predictions of what to expect for the rest of this month and the holiday season.
To quickly recap the last few months, August and September (minus the last week) largely marked a return to off-season crowd levels. Some fans who visit annually during this time of year reported “feels like” crowds that were higher than they expected. Nevertheless, it was still the best stretch of the year from the perspective of wait times, which were about 30-32 minutes across all of Walt Disney World, on average.
That is especially true once school went back into session through the third week of September. During that stretch, crowd levels were typically in the 1/10 to 3/10 range. That bottomed out during the first two weeks of September 2023, when the average resort-wide wait times were 25-26 minutes (the lowest levels of the entire year). It’s worth noting that these two weeks were the slowest of last year, too.
Accordingly, if you’re planning a 2024 Walt Disney World vacation and wait times are your singular concern, you can’t beat August 25 to September 8, 2024. With that said, there’s a reason those dates don’t make our list of the 10 Best and 10 Worst Weeks to Visit Walt Disney World in 2023 to 2025. (If you’re seriously considering those dates, you can also see Is It Still Worth Visiting During “Fall” Off-Season at Walt Disney World?) But I digress–this is a post recapping recent and upcoming crowd trends, not next year.
As always, wait times are not conclusive of attendance or in-park congestion. Additionally, frame of reference is a major issue. Walt Disney World attendance has increased by several million people over the course of the last decade-plus through 2019. Then attendance plummeted for a year-plus, spiked as a result of pent-up demand for 2 years, and is now coming back to reality. So your individual perception of crowds may vary considerably based on when you last visited.
There are also several other variables that can impact “feels like” crowds, including but not limited to festivals at EPCOT, weather, guest demographics, ride breakdowns, operational efficiency, wait times manipulation, and park operating hours. This is just a partial list, and all of those are significant variables right now.
In short, wait times are an imperfect measure of Walt Disney World’s raw attendance or crowds. Imperfect as they might be, wait times are still the best measure of crowds–and the only objective one. The alternative is relying on anecdotal observations, which are much more flawed and incomplete.
It’s impossible for anyone to be everywhere at once, and hard to know whether you’re in a pocket of crowds, what efficiency issues exist, and whether guests are disproportionately doing attractions or loitering about. Yada yada yada. See our 2023-2024 Walt Disney World Crowd Calendars for more disclaimers about the limitations, strengths, weaknesses, etc. of this type of post.
With that out of the way, let’s dig into the data and look at Walt Disney World wait times. As always, all graphs and stats are courtesy of Thrill-Data.com:
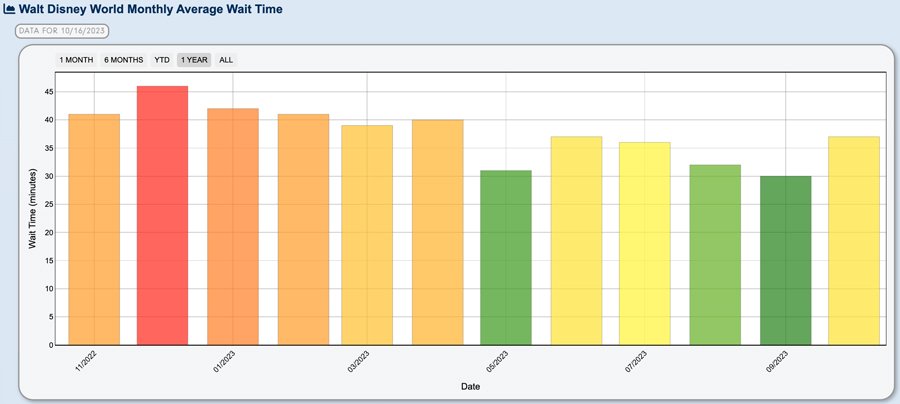
We’ll start with the monthly numbers for Walt Disney World as a whole.
Halfway through the month, and October 2023 isn’t looking too bad. Busier than May, August or September–but that was to be expected. The 37 minute month to date average puts it slightly above July and exactly equal to June. However, that doesn’t tell the full story…
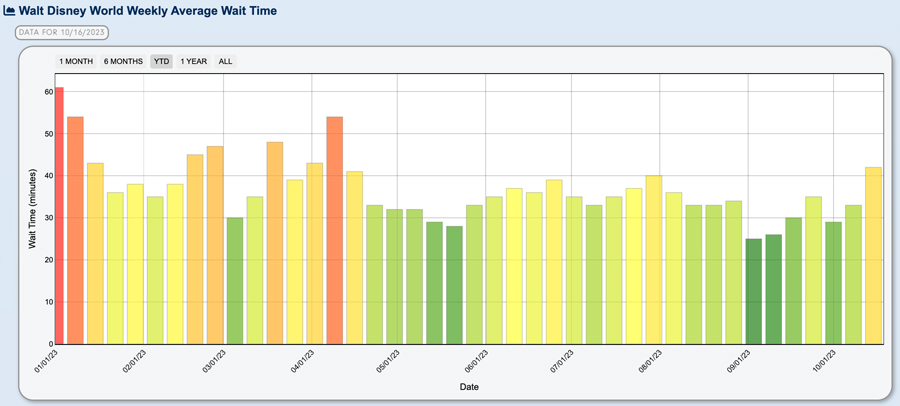
More illustrative is the weekly wait times data for Walt Disney World.
Here we see that the trend is not your friend. After a strong finish to September, there was a lull to start October but wait times have been increasing ever since–and last week had the worst wait times since Easter. If wait times for the next couple of weeks are closer to last week than they are to the first week of October (and they almost certainly will be), this month’s crowd level will easily surpass the summer months.
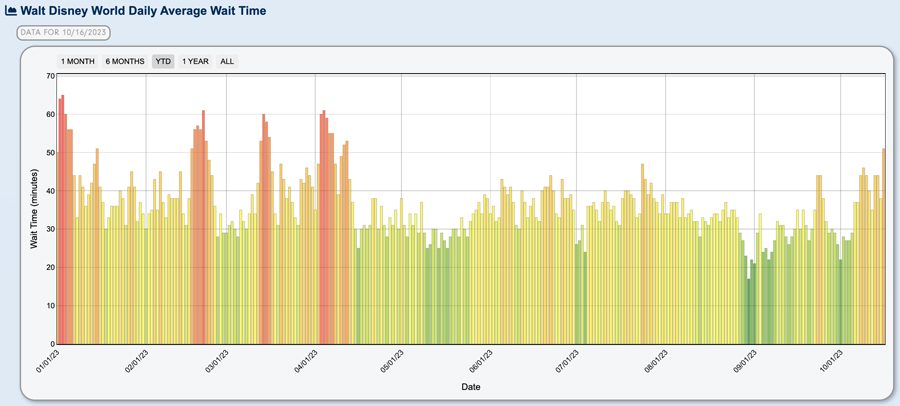
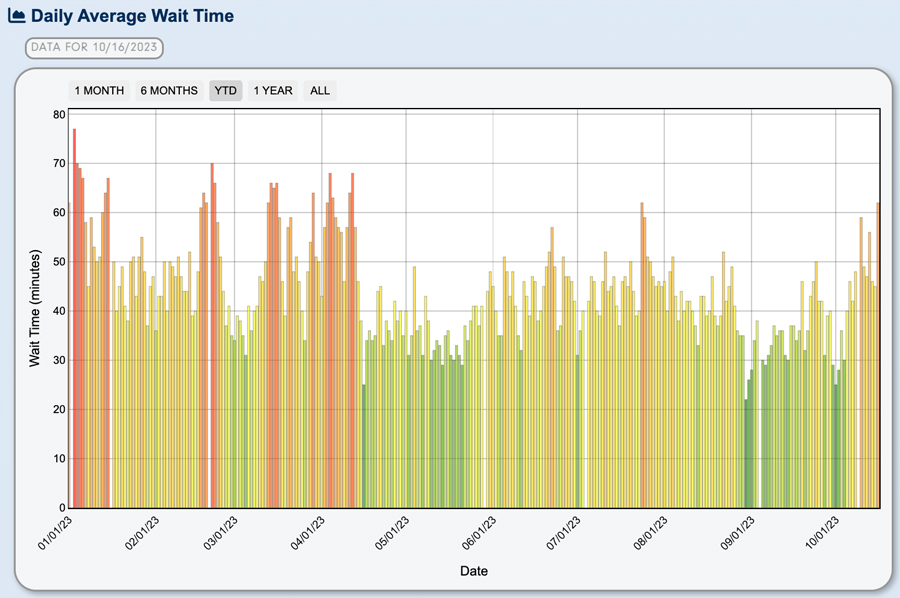
Above is a look at the daily numbers. Walt Disney World has been experiencing elevated attendance during the Columbus Day/Indigenous Peoples’ Day holiday weekend and weekdays thereafter. Many schools use this as a proxy for setting their fall break, making it a popular post-summer and pre-holiday time for vacations.
Consequently, crowd levels spiked on October 6, 2023 and have been moderate to high ever since. As a whole, the average wait time across all attractions during that stretch was 42 minutes. (That’s actually down from 47 minutes during the same stretch last year!)
Perhaps the most interesting number of all is the 51 minute average today (October 16, 2023). While we expected it to be busy due to another round of fall break, that’s higher than expected. It’s possible that the official opening of Moana’s Journey of Water or expectations about Disney’s 100th Anniversary have also exacerbated crowds. It’ll be interesting to watch the rest of this week to see what happens.
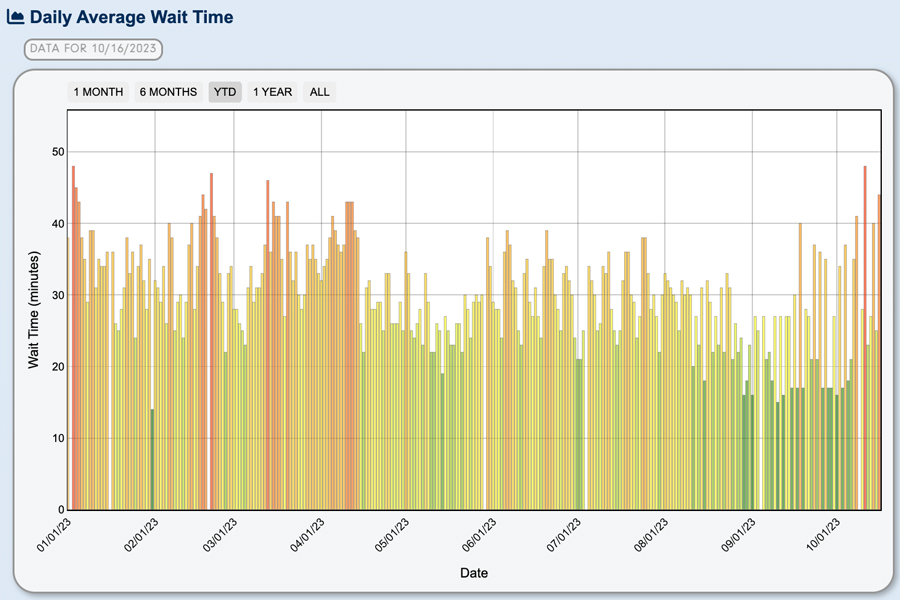
For park by park analysis, we’ll start with Magic Kingdom. This graph continues to do its prickly porcupine impression for Party Season, bouncing between peaks and valleys depending upon whether the park closes at 6 pm or 9/10 pm. As usual, this is due to Mickey’s Not So Scary Halloween Party, which disrupts the demand dynamic at Magic Kingdom. This is something we’ve covered at length, again and again. (See Least Crowded Late 2023 Days at Magic Kingdom for dates that we recommend doing MK.)
One interesting thing we’re starting to see here is party-shortened days that have crowd levels of 2/10 instead of 1/10. We warned you that this would happen, and it’ll only get worse. Expect some 3/10 and 4/10 party days on the ‘uncrowded’ end of the spectrum going forward due to rising crowd levels across the board and fewer options to avoid MNSSHP and MVMCP. The “good” news is that the non-party days will get even worse, making the party days comparatively more attractive despite those higher crowd levels.
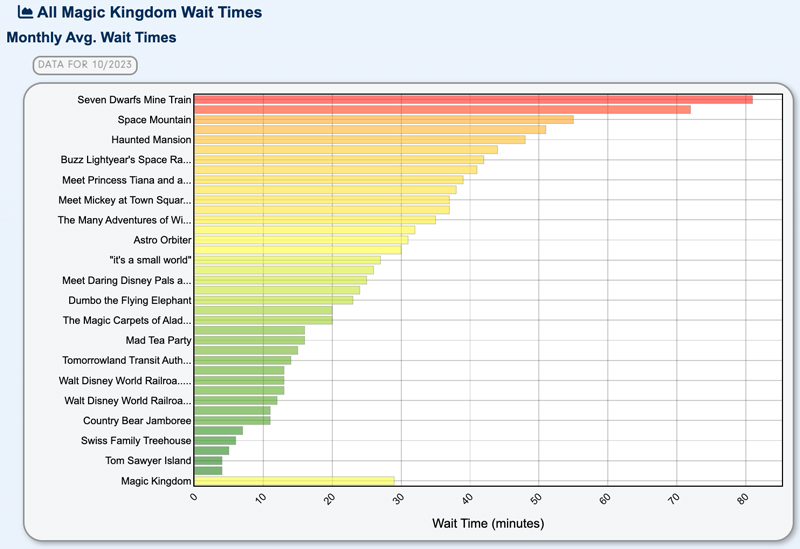
Above are the specific ride averages for Magic Kingdom for October 2023 month-to-date.
Those numbers get much worse when narrowed to the last week–8 attractions have average wait times above an hour. Last month, there were only two attractions that hit or exceeded the 60 minute mark (Peter Pan’s Flight and Seven Dwarfs Mine Train).
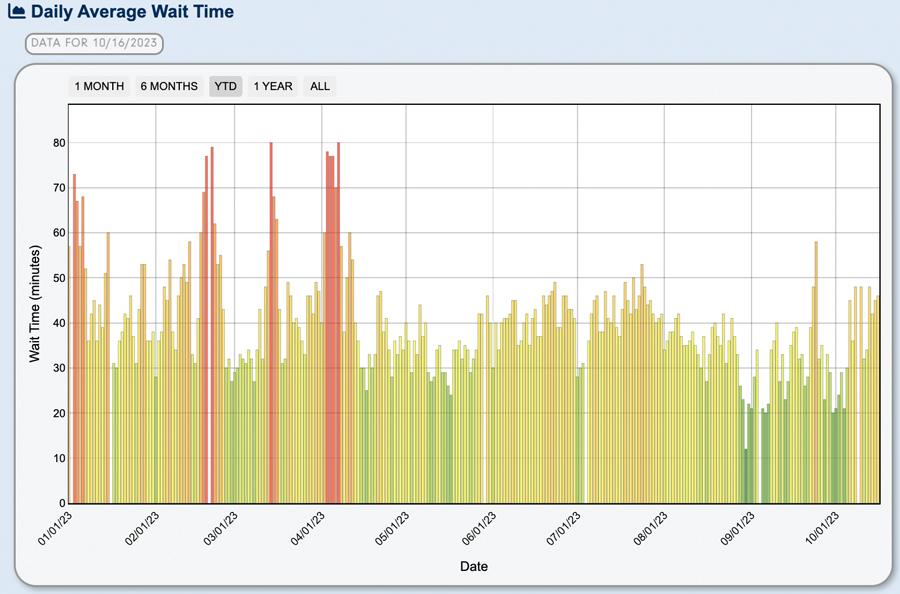
Next up is Animal Kingdom.
Animal Kingdom isn’t too bad yet, and is just returning to its summer highs. However, the park’s limited ride roster buckles whenever crowds are heavy, meaning that those wait times can spiral out of control if attendance keeps creeping up. It’s the park with the biggest range between lows and highs.
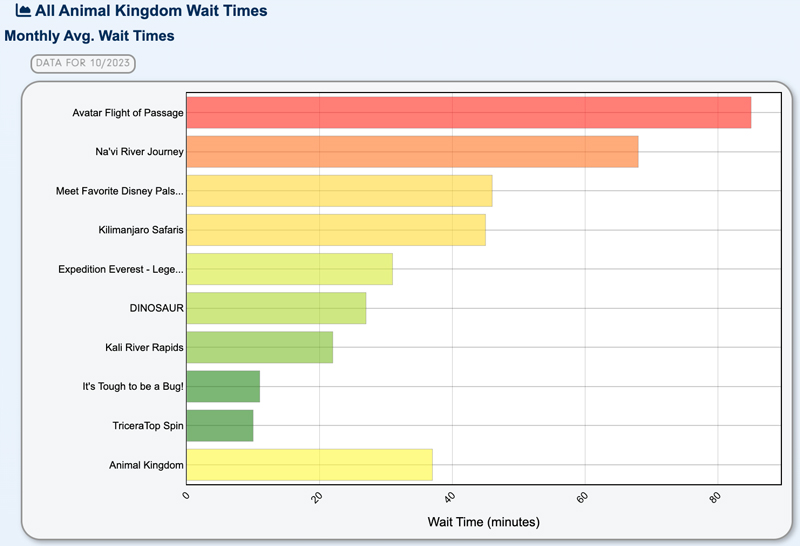
Here are Animal Kingdom ride averages for the month. Both Pandora attractions are eclipsing an hour, but that’s it. Still not terrible once you get past the top four attractions.
As a bit of an aside, we’ve recently heard from several readers who experienced long lines at Kilimanjaro Safaris and actual wait times that were worse than posted wait times. While I can’t speak to why that happened on those specific days, 98 times out of 100, it’s due to wildlife in the path delaying dispatches. Don’t underestimate what a recalcitrant rhinoceros can do to wait times! Or, who knows, maybe Bob Chapek made his not-so-triumphant return to pet some hippopotamus. Anything is possible?
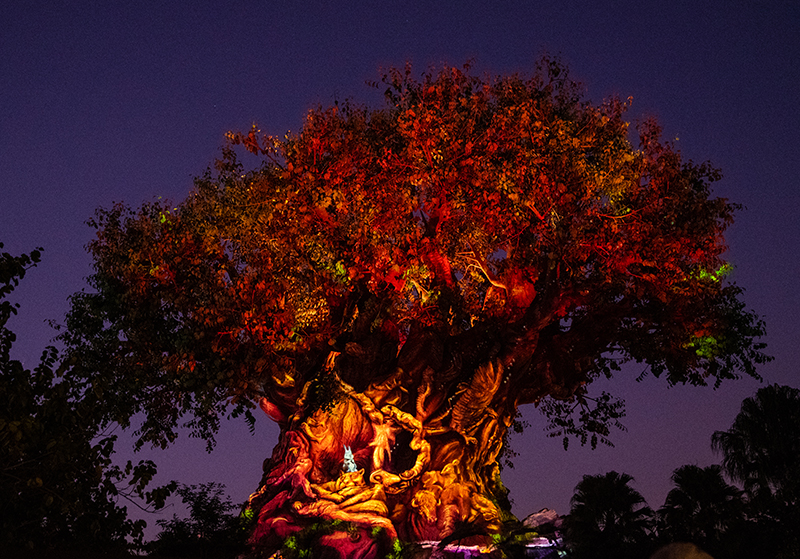
On a positive note, Animal Kingdom now officially closes after sunset! It’s only by 5 minutes, but it’s a start and we’ll take it. I don’t see Tree of Life Awakenings back on the schedule just yet–but if they’re not being shown already, that should start really soon. We highly recommend staying for evenings in DAK to enjoy the Tree of Life Awakenings, plus Pandora and the rest of the park after dark.
Our Animal Kingdom Afternoon Arrival Strategy is once again the ideal approach for this park. Alternatively, Early Entry or rope drop are great. Genie+ is a waste of money at Animal Kingdom for at least the next month. Please don’t be fooled by the “bargain” pricing on Genie+ at Animal Kingdom. Remember, something is only a deal if you actually need it–otherwise, you’re just a hoarder. (Well, you can’t really hoard Lightning Lanes in the same sense…but you get the idea!)
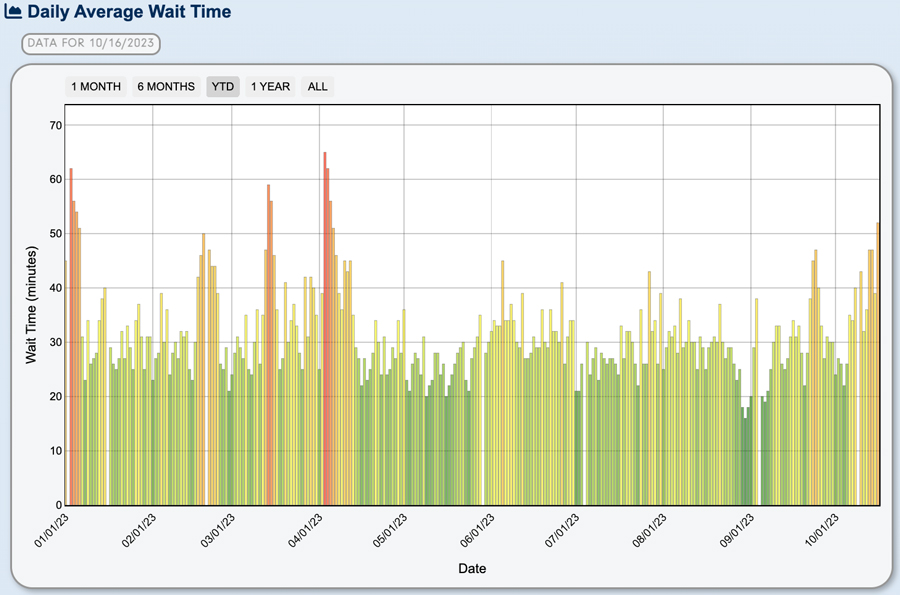
EPCOT is starting to see its busiest days in months.
There will undoubtedly be some reprieves from the crowds at EPCOT in the next couple months, but I wouldn’t expect much. To the contrary, there’s likely to be renewed interest in EPCOT now that Moana’s Journey of Water is officially open plus World Celebration and Luminous are about to debut. Very sad news for fans of construction walls and giant dirt pits!
Even these wait times are not the full story. EPCOT is notorious for a divergence between “feels like” crowds/congestion and wait times. This is especially true in World Showcase, during festivals, and on weekends and evenings. World Showcase is worse on weekends due to day drinking, while evenings are busier for people Park Hopping over to watch the fireworks. In short, people show up for things other than attractions, so that elevated attendance isn’t picked up by wait time data. We try to avoid EPCOT on weekends during this time of year, and that’s precisely why.
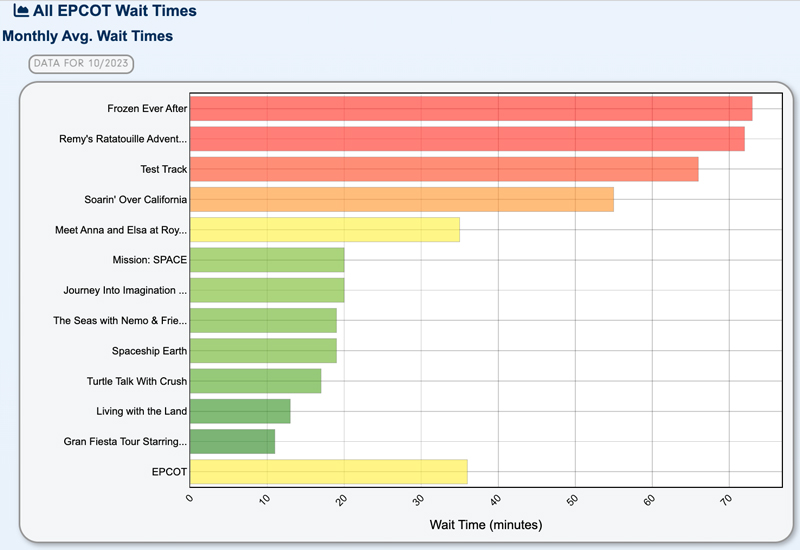
Average wait times for Frozen Ever After, Remy’s Ratatouille Adventure, Test Track, and Soarin’ Over California are all elevated. If this is narrowed to just the last week, all of these are averaging wait times of over 80 minutes.
Given that the next few months are popular travel times for repeat Walt Disney World visitors, we wouldn’t be surprised if OG Soarin’ surpasses Test Track. (Although maybe not, if regulars want to get ‘last rides’ on the current version of Test Track and/or it experiences extended downtime, causing higher wait times when it’s open.)
Finally, there’s Disney’s Hollywood Studios.
DHS is trending upward, but not without ups and downs. Our theory–and this is supported by daily wait times–is that Disney’s Hollywood Studios has become the “counterprogramming park” to Party Season in Magic Kingdom. This makes sense, as EPCOT only has an interim fireworks show and Fantasmic is back at DHS.
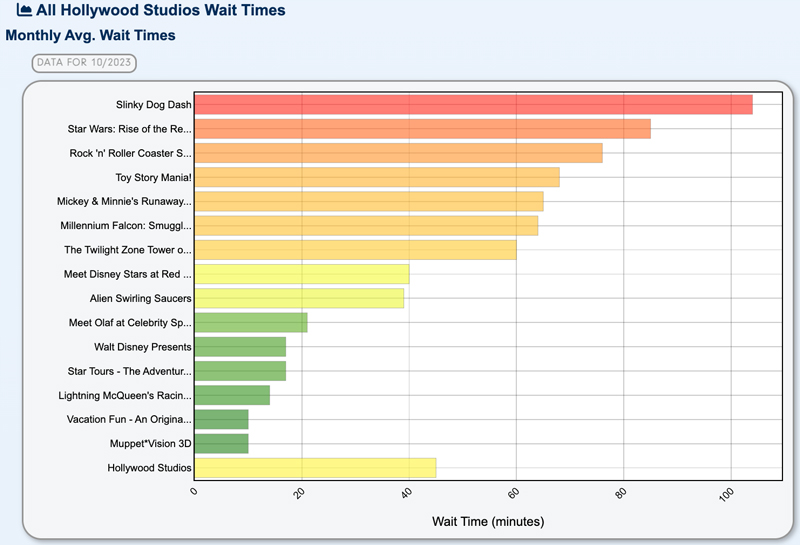
Above are ride-by-ride wait times for Disney’s Hollywood Studios this month. These are the worst of any park, with 7 attractions at or above 80 minutes. For the past week, Slinky Dog Dash, Star Wars: Rise of the Resistance, and the Twilight Zone Tower of Terror are all currently in triple digits territory.
That’s pretty intimidating, and might reflexively push you towards Lightning Lanes. That’s honestly not a bad idea, and DHS is our #2 park at Walt Disney World for buying the Genie+ service. But as discussed in my recent post, I Did Every Ride at Disney’s Hollywood Studios Before 11am Via Standby Lines, Lightning Lanes are not strictly necessary. (Note: I did that before fall break. You still accomplish a good portion of that right now on a good day, but replicating that will be impossible for the rest of this month and most of the next two.)
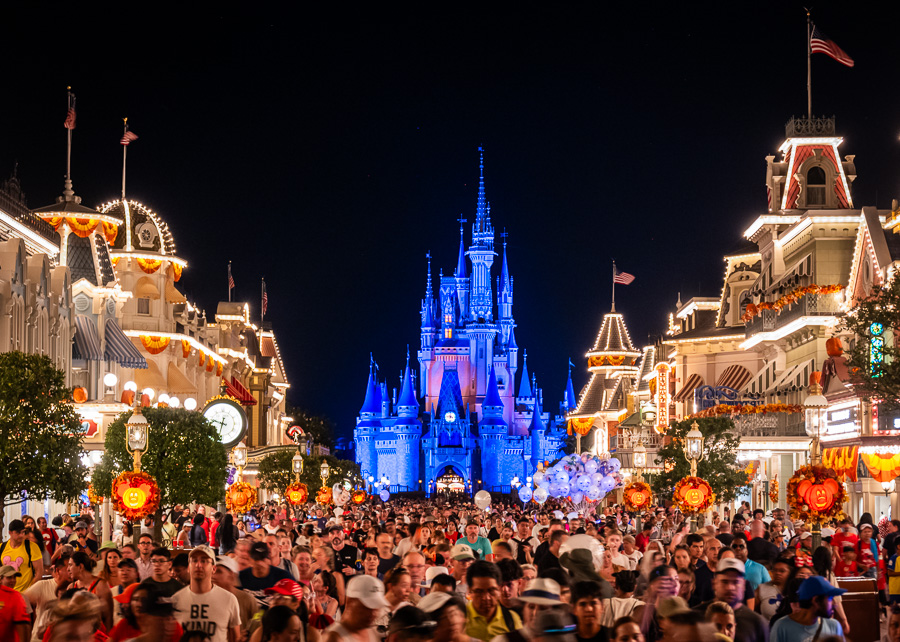
Turning to commentary, we don’t have a lot to add. In Walt Disney World’s Busiest Week Since Easter is Happening Soon, we already discussed how the most recent week would have–as the first title suggests–the worst crowds since Easter. And it did!
We’ve warned about this in our October 2023 Crowd Calendar for a while, but the Columbus Day/Indigenous Peoples’ Day long weekend still catches a lot of visitors by surprise. Although not many people have the holiday off from work, it’s very busy at Walt Disney World during that long weekend and the dates thereafter because it coincides with fall break for many school districts.
Around this time every year, we get questions/complaints from readers who are (presumably) in the parks and encountering “unexpectedly” bad crowds. The whole reason we wrote that ‘busiest week since Easter’ post was to provide another advance warning, because this has been completely expected for several years now.
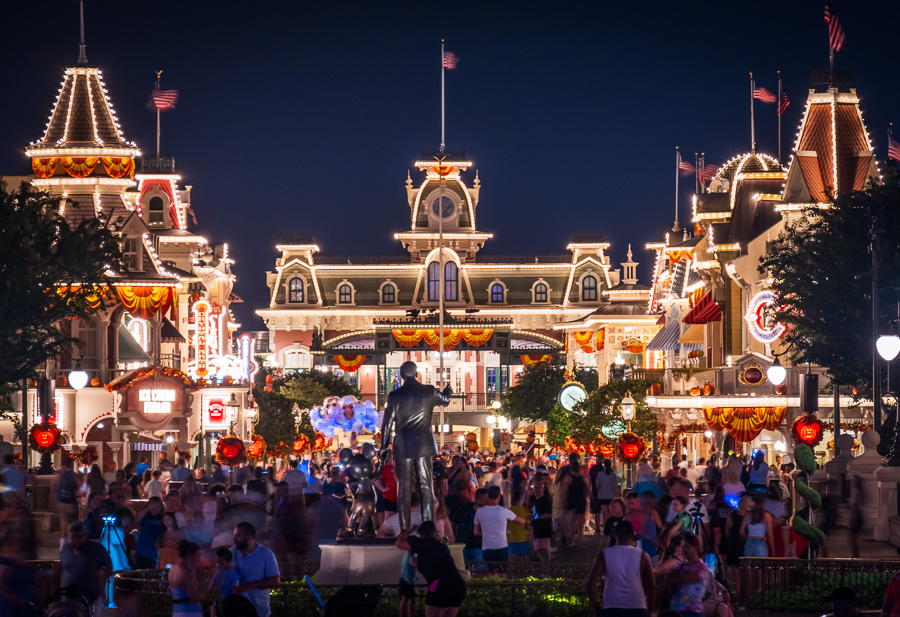
Going forward, we’re expecting a drop-off in crowds this week and next week, but nothing on par with August or September. The off-season is officially over–there won’t be slow days like that (barring a hurricane scare) again until January 2024. At best, the next couple of weeks will be more like regular dates during the spring or the summer.
With that said, we don’t have as high of a degree of certainty about the next couple of weeks as the last couple. There are still several major school districts–including some in South Florida–with fall breaks on the schedule in October 2023. Those could end up causing the next couple of weeks to be surprisingly busy, especially on Fridays and Mondays.
Our expectation is that the last full week is the second-busiest of the month, but still not nearly as bad as last week/fall break. The big question is whether the remainder of the month is busy enough for October to surpass the first few months of the year as the busiest month of 2023 (to date). It’s certainly possible, but I doubt it’ll happen. (October might beat March-April, though.)

Ultimately, November and December will almost certainly surpass all months that came before, including October (regardless of where crowd levels land this month once the dust settles). Even with the lulls in each of those months–which includes Our Favorite Week of the Entire Year at Walt Disney World (During Christmas)–the high highs are enough to put November and December over the top.
The week encompassing Halloween and the start of November 2023 will likely be busy. The Wine & Dine Half Marathon Weekend (November 2-5, 2023) will also elevate crowds, but that should be partially upset by that being the gap between two holiday seasons. The week after that includes both Jersey Week and Veterans’ Day, and will be busy as a result.
However, we’re hopeful that the week after that (November 12-17, 2023) and the week after Thanksgiving (November 26 to December 2, 2023–you might even be able to expand that to November 25 to December 3) will see reprieves from the peak season crowds. Those dates along with a scattering of others in December shouldn’t be terrible.
After the second full week of December 2023, all bets are off. Crowds won’t let up in any consistent manner until after winter school breaks end in the second week of January 2024. If you’re wondering why Walt Disney World is rolling back so many policies on January 9, 2024 instead of New Year’s Day, that’s precisely why. That’s the next day of the off-season at Walt Disney World!
Planning a Walt Disney World trip? Learn about hotels on our Walt Disney World Hotels Reviews page. For where to eat, read our Walt Disney World Restaurant Reviews. To save money on tickets or determine which type to buy, read our Tips for Saving Money on Walt Disney World Tickets post. Our What to Pack for Disney Trips post takes a unique look at clever items to take. For what to do and when to do it, our Walt Disney World Ride Guides will help. For comprehensive advice, the best place to start is our Walt Disney World Trip Planning Guide for everything you need to know!
YOUR THOUGHTS
Thoughts on the very busy fall break at Walt Disney World? Predictions for the rest of October through December 2023? How bad do you expect crowds to get for the heart of Halloween and the holiday season? Have you done Magic Kingdom during the day of a MNSSHP night? Thoughts on our forecast, analysis, or anything else? Agree or disagree with our commentary about “feels like” crowds v. wait times? If you’ve visited in prior months during the last year, how did crowds compare between then and now? What did you think of the wait times? Any parks or times of day noticeably worse than the others? Do you agree or disagree with anything in our report? Any questions we can help you answer? Hearing your feedback–even when you disagree with us–is both interesting to us and helpful to other readers, so please share your thoughts below in the comments!


